Wireshark Tutorial: The Complete Guide to Packet Capture & Network Analysis
Capture and inspect live network traffic in real time. Wireshark is the world's most widely used protocol analyzer, and this guide walks through everything from your first capture to reconstructing full TCP conversations, reading Statistics reports, and scripting captures with tshark.
⚠️ Legal Notice: Only capture network traffic on networks you own or have explicit written permission to analyze. Unauthorized packet sniffing may violate wiretapping, privacy, and computer misuse laws, even on shared, public, or employer networks. This guide is for authorized lab use, personal networks, and professional network administration only.
On this page
- What is Wireshark?
- How Wireshark Works
- Installing Wireshark
- Capture Permissions by OS
- Welcome Screen
- Interface Components
- Starting a Capture
- Generating Traffic
- Filtering Packets
- Capture Filters vs Display Filters
- Common Display Filters
- Filter Operators & Logic
- Packet Colors
- Reading the TCP Handshake
- Follow TCP Stream
- The Statistics Menu
- Exporting Objects & Saving Captures
- Command-Line Capture with tshark
- Real-World Use Cases
- Common Beginner Mistakes
- vs. Other Traffic Tools
- Glossary
- FAQs
- Related Guides
What is Wireshark?
Wireshark is a free and open-source packet analysis tool that captures data traveling across a network interface and decodes it into human-readable form. Instead of seeing "traffic" as an abstract concept, Wireshark lets you see every individual packet — its source, destination, protocol, and payload — the way it actually crossed the wire or the airwaves.
Originally released in 1998 under the name Ethereal, the project was renamed Wireshark in 2006 after a trademark dispute and has since become the de facto standard tool for network troubleshooting, protocol development, and security analysis worldwide. It's maintained by a large open-source community and the Wireshark Foundation, and it ships dissectors for well over a thousand protocols, from ordinary HTTP and DNS to industrial control system protocols and proprietary IoT traffic.
In practice, Wireshark sits at the intersection of three disciplines: network engineering (why is this connection slow?), software development (is my protocol implementation sending what I think it's sending?), and security (what did this device actually talk to, and what did it send?). That's exactly why it shows up in networking courses, SOC analyst job postings, and CompTIA Network+/Security+ objectives alike.
How Wireshark Works
- Puts the selected network interface into promiscuous mode (on wired networks) or monitor mode (on Wi-Fi), so it can see traffic not addressed only to your machine
- Uses a packet capture library — libpcap on Linux/macOS or Npcap on Windows — to pull raw frames off the interface
- Passes each frame through a dissector chain that breaks it down layer by layer: Ethernet → IP → TCP/UDP → application protocol (HTTP, DNS, TLS, etc.)
- Displays the decoded result as a scrollable, filterable list, with a details pane showing every field Wireshark was able to parse
- Optionally writes everything to a .pcap or .pcapng file on disk for later analysis, sharing, or evidence retention
Because Wireshark only reads traffic rather than generating it, it's considered a passive tool — it won't alter packets in transit (unless you explicitly use it with an inline TAP or bridge configuration, which is an advanced setup outside the scope of this guide).
Installing Wireshark
Wireshark is free and available for Windows, macOS, and Linux from the official project site. A few notes that save beginners real time:
Windows
The Windows installer bundles Npcap, the packet capture driver. Make sure the "Install Npcap" checkbox is left enabled during setup — without it, Wireshark opens but shows zero interfaces to capture from.
macOS
Install via the official .dmg or with Homebrew: brew install --cask wireshark. macOS additionally requires the ChmodBPF helper (installed automatically) so your user account can read from /dev/bpf* without running as root every time.
Linux
Most distributions package it directly:
On Debian-based systems you'll be asked whether non-root users should be allowed to capture packets — say yes, then add your user to the wireshark group so you don't need sudo for every capture session:
Log out and back in for the group change to take effect.
Capture Permissions by OS
Packet capture requires elevated access because it reads raw traffic other applications shouldn't normally see. If Wireshark opens but the interface list is empty or greyed out, it's almost always a permissions issue, not a bug:
| OS | What's required |
|---|---|
| Windows | Npcap installed; running as Administrator is not required for normal use once Npcap is set up correctly |
| macOS | ChmodBPF helper installed (comes with the official package); first launch may prompt for permission |
| Linux | User added to the wireshark group, or run via sudo — group membership is preferred so you're not running the whole GUI as root |
Wireshark Welcome Screen
Wireshark Welcome Screen
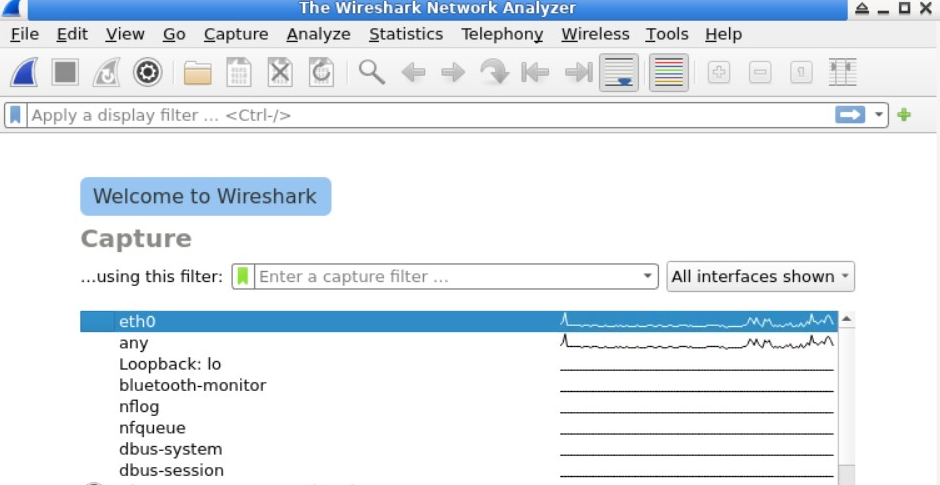
The welcome screen shows every available network interface — Wi-Fi, Ethernet, loopback, and any VPN adapters — along with a small live traffic sparkline next to each one, so you can tell at a glance which interface is actually carrying traffic before you commit to capturing on it. Double-clicking an interface, or selecting it and clicking the blue shark-fin icon, starts capturing immediately.
If you're on a laptop with both Wi-Fi and Ethernet, always check the sparkline first — it's easy to start a capture on the wrong adapter and wonder why nothing shows up.
Main Interface Components
Menu Bar
Access file options, capture and analyze settings, statistics tools, and export functions. This is also where you'll find Edit → Preferences, useful for adjusting time display format, name resolution, and column layout.
Toolbar
Quick controls for starting, stopping, and restarting captures, plus the interface selector and the display filter input field.
Display Filter Bar
Allows filtering of the packets already captured, based on protocol, IP address, port, or dozens of protocol-specific fields. The bar turns green when a filter expression is syntactically valid and red when it isn't — a small but genuinely useful piece of instant feedback.
Packet List
Shows every captured packet in a single scrollable table, with columns for packet number, timestamp, source, destination, protocol, length, and a plain-English info summary.
Packet Details Pane
Click any packet in the list and this pane shows a collapsible, layer-by-layer breakdown — Frame → Ethernet → IP → TCP/UDP → application protocol — so you can drill into exactly which field you care about.
Packet Bytes Pane
Shows the raw hex and ASCII representation of the selected packet. Clicking a field in the Details pane automatically highlights the corresponding bytes here, which is one of the fastest ways to learn how a protocol is actually structured on the wire.
Starting Packet Capture
Starting Packet Capture
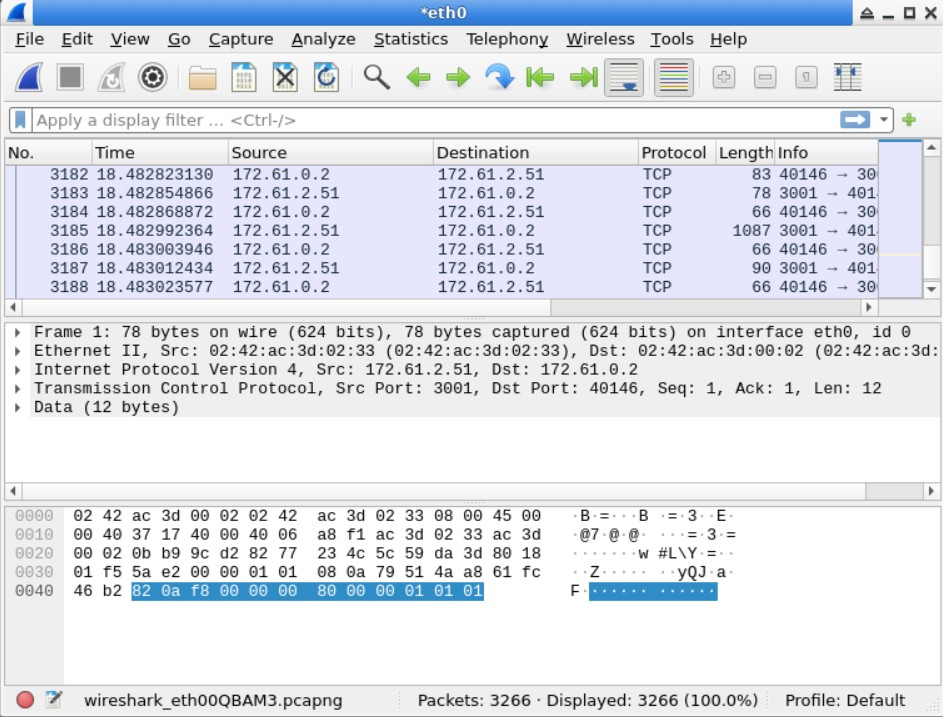
Select a network interface and Wireshark will begin capturing traffic instantly. You will see packets appearing in real time, updating continuously as new frames arrive on the interface.
Understanding the Interface
Wireshark Interface
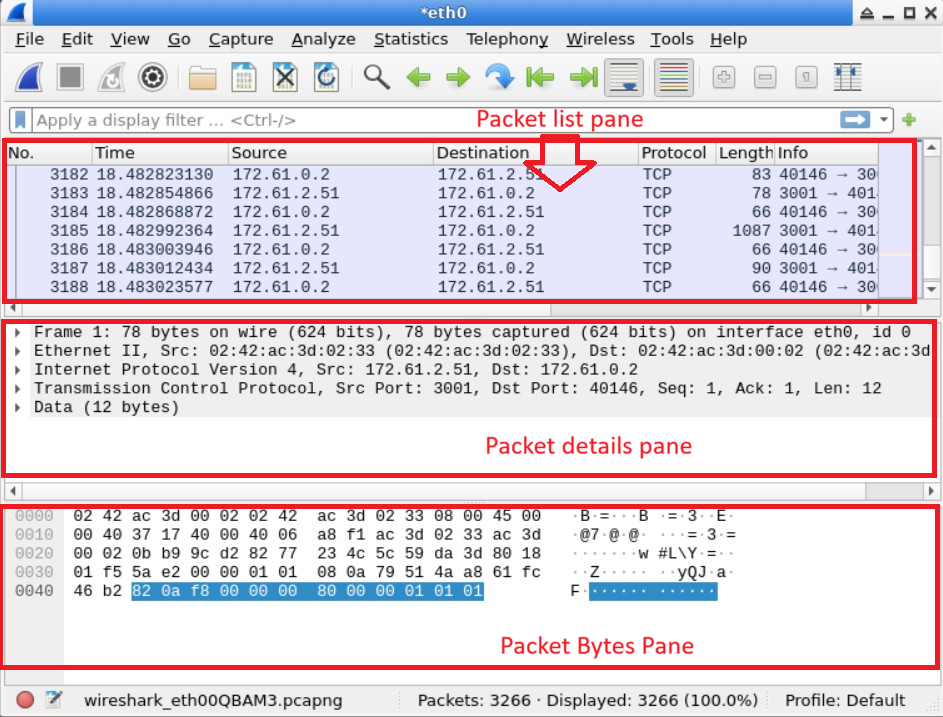
- Packet List Pane: Overview of captured packets, one row per packet
- Packet Details Pane: Structured, expandable protocol breakdown of the selected packet
- Packet Bytes Pane: Raw hexadecimal and ASCII data, synced to whatever field is selected above
Generating Traffic for Analysis
To analyze packets, you need traffic to capture. A simple way to generate some is using the ping command:
This generates ICMP Echo Request and Echo Reply packets that Wireshark can capture and decode.
Ping Requests

Captured Packets

For more realistic traffic, open a browser and visit a few sites while capturing — you'll see the full picture: DNS lookups resolving the hostname, a TCP handshake to the server, a TLS handshake negotiating encryption, and finally encrypted application data flowing back and forth.
Stopping Packet Capture
Stop Capture Button

Click the red square button to stop capturing packets once enough data is collected. There's no strict rule for "enough" — for learning purposes, 30–60 seconds of normal browsing is plenty; for troubleshooting an intermittent issue, you may need to capture for much longer or set up a ring buffer (File → Capture File Properties, or via -b options in tshark) so you don't run out of disk space.
Filtering Packets
Once you have packets on screen, filtering is how you find the ones that matter. Type directly into the display filter bar. Example filter:
This shows only ICMP packets — useful right after the ping example above.
Filtered Packets

A faster way to build filters without memorizing syntax: right-click any field in the Packet Details pane and choose Apply as Filter → Selected. Wireshark writes the correct expression for you, which is also a great way to learn the field names as you go.
Capture Filters vs. Display Filters
This is the single most common point of confusion for people new to Wireshark, and it's worth being precise about it.
Capture filters
Set before you start capturing, in the interface selection screen or via Capture → Capture Filters. They use BPF (Berkeley Packet Filter) syntax and decide which packets are written to the capture buffer at all — anything that doesn't match is discarded permanently and can never be recovered from that capture session.
Display filters
Applied after capture, in the display filter bar. They use Wireshark's own filter syntax (different from BPF) and only control what's shown — every packet is still sitting in the capture buffer or file underneath, and you can change or clear the display filter at any time without losing anything.
| Capture filter | Display filter | |
|---|---|---|
| When applied | Before capture starts | After packets are captured |
| Syntax | BPF | Wireshark filter language |
| Effect | Discards non-matching packets permanently | Hides non-matching packets from view only |
| Typical use | Reducing capture size on a busy interface | Investigating specific traffic after the fact |
Common Display Filters
| Filter | What It Shows |
|---|---|
| http | Unencrypted HTTP traffic |
| tls | TLS/SSL handshake and encrypted application traffic |
| tcp.port == 443 | Traffic on port 443 (typically HTTPS) |
| ip.addr == 192.168.1.1 | All traffic to or from a specific IP |
| dns | DNS query and response traffic |
| tcp.flags.syn == 1 | TCP connection attempts (SYN packets) |
| tcp.flags.reset == 1 | Reset (RST) packets, often indicating a refused or torn-down connection |
| tcp.analysis.retransmission | Packets Wireshark has flagged as retransmissions — a strong sign of packet loss or latency issues |
| arp | ARP traffic, useful for spotting spoofing attempts |
| http.request.method == "POST" | HTTP POST requests specifically, useful when hunting for form submissions in plaintext HTTP |
| dns.qry.name contains "example" | DNS queries where the queried name contains a substring |
| frame contains "password" | Any packet with that literal string anywhere in the raw frame (use sparingly — it's slow on large captures) |
Filter Operators & Logic
Filters can be combined using standard logical operators, and Wireshark accepts both the symbolic and the English form:
| Operator | Meaning | Example |
|---|---|---|
| && / and | Both conditions must be true | ip.addr == 192.168.1.1 && tcp.port == 443 |
| || / or | Either condition may be true | tcp.port == 80 || tcp.port == 443 |
| ! / not | Negates a condition | !(arp || dns) |
| ==, !=, >, < | Comparison operators | frame.len > 1000 |
| contains | Substring match within a field | http.host contains "login" |
| matches | Regular-expression match | http.host matches "^www\\." |
Two examples worth keeping handy: ip.addr == 192.168.1.1 && tcp.port == 443 narrows to HTTPS traffic for one device, while !(arp || dns) is a quick way to hide the background chatter and focus on everything else.
Understanding Packet Colors
Wireshark color-codes packets by default so patterns jump out visually without reading every row:
| Color | Typical meaning |
|---|---|
| Light purple | TCP traffic |
| Light blue | UDP traffic |
| Light green | HTTP traffic |
| Black background, red text | Packets Wireshark has flagged as errors or malformed (checksum errors, malformed packets) |
| Black background, yellow text | TCP anomalies such as retransmissions or out-of-order segments |
| Grey | TCP connections that have been reset or closed |
These are fully customizable under View → Coloring Rules, where you can add your own rule based on any display filter expression — a common one is coloring your own management or admin traffic a distinct color so it never gets lost in a busy capture.
Reading the TCP Handshake
Almost every TCP-based troubleshooting session starts with confirming the handshake completed cleanly. Filter for tcp.flags.syn == 1 or simply tcp and look for this three-packet pattern between client and server:
- SYN — client requests a connection, proposing an initial sequence number
- SYN, ACK — server accepts and proposes its own sequence number
- ACK — client acknowledges, and the connection is now established
If you only ever see a SYN with no reply, the destination is likely unreachable, firewalled, or not listening on that port. A SYN followed immediately by an RST means the port is reachable but nothing is listening, or a firewall is actively rejecting the connection rather than silently dropping it. Learning to recognize this three-packet shape at a glance is one of the fastest diagnostic skills to build.
Follow TCP Stream
Reading a conversation packet-by-packet is tedious once you actually need to understand what was said. Right-click any TCP packet and choose Follow → TCP Stream and Wireshark reassembles the entire conversation — every request and response, in order, with client traffic and server traffic shown in different colors — as one readable block of text.
This is invaluable for reading plaintext HTTP requests/responses, debugging application-layer protocols, or confirming exactly what data an application sent before a connection failed. It works the same way for UDP (Follow → UDP Stream) and for TLS if you've supplied the session keys, which is covered further down under real-world use cases.
The Statistics Menu
The Statistics menu turns a raw capture into aggregate views, and it's where a lot of real troubleshooting actually happens rather than in the packet list itself.
Protocol Hierarchy
Statistics → Protocol Hierarchy shows a percentage breakdown of every protocol present in the capture. It's the fastest way to answer "what is actually on this network?" in one glance — useful for spotting an unexpected protocol (like plaintext FTP or an unknown proprietary port) that shouldn't be there.
Conversations
Statistics → Conversations lists every unique pair of endpoints that talked to each other, along with bytes and duration. Sorting by bytes transferred is a quick way to find whichever host is generating the most traffic on a link.
Endpoints
Similar to Conversations, but grouped by individual host rather than by pair — useful for identifying every device that appeared on the network during the capture window.
I/O Graphs
Statistics → I/O Graph plots traffic volume over time and can be filtered per-protocol, which makes intermittent issues (a spike every 30 seconds, a slow steady drop-off) visible in a way the packet list never will be.
Exporting Objects & Saving Captures
Two things worth knowing once you're past the basics:
Export HTTP/DNS/SMB objects
File → Export Objects → HTTP (or DNS, SMB) pulls out every file transferred over that protocol in the capture — images, documents, executables — as individual files you can save to disk. This is standard practice in malware analysis for pulling a payload out of a capture for separate examination in an isolated environment.
Saving and file formats
Captures save as .pcapng by default (the modern format, supporting comments and multiple interfaces) or the older .pcap for compatibility with tools that haven't updated. File → Save As lets you export just the currently displayed (filtered) packets rather than the whole capture — handy for sharing a small, relevant slice of a much larger file with a colleague.
Command-Line Capture with tshark
Wireshark ships with a command-line sibling called tshark that uses the same capture engine and dissectors but without the GUI — ideal for remote servers, scripted captures, or automated log pipelines.
The three flags worth memorizing first: -i selects the interface, -w writes to a file, -r reads an existing file back in, -Y applies a display filter, -f applies a capture filter, and -c caps the number of packets captured. Everything you learned about capture-vs-display filter syntax above applies directly here.
Real-World Use Cases
- Network troubleshooting: Diagnosing slow connections, dropped packets, retransmissions, or misconfigured devices
- Security incident response: Reviewing captured traffic after a suspected breach to reconstruct what actually happened
- Protocol development: Verifying custom network protocols behave as expected on the wire
- Malware analysis: Observing malware command-and-control communication in an isolated, air-gapped lab
- Compliance auditing: Confirming sensitive data isn't sent in plaintext, and that TLS is actually in use where policy requires it
- TLS troubleshooting: With a browser or server configured to log session keys (via the SSLKEYLOGFILE environment variable) loaded into Wireshark's TLS preferences, encrypted HTTPS traffic can be decrypted for legitimate debugging of your own applications
Wireshark is most useful paired with something actively generating traffic to inspect. Running an Nmap scan against your own lab network is a common way to see what a real scan looks like at the packet level — and if you're analyzing authentication attempts, comparing that traffic against a Hydra session in a lab environment helps make brute-force patterns easier to recognize in the wild.
If you're building out a broader offensive-security lab, Kali Linux ships with Wireshark preinstalled alongside tools like Metasploit and Burp Suite — worth reading together if you're new to the toolchain. On the defensive side, packet capture is one of many skills covered in our SOC analyst career path guide.
Common Beginner Mistakes
- Capturing on the wrong interface — always check the traffic sparkline on the welcome screen first
- Confusing capture and display filter syntax — BPF and Wireshark's filter language look similar but aren't interchangeable
- Expecting to read modern HTTPS payloads without keys — encrypted traffic shows metadata (size, timing, SNI hostname) but not content, by design
- Leaving a capture running indefinitely — long unattended captures on a busy interface can fill disk space fast; use a ring buffer for extended monitoring
- Capturing on networks without authorization — see the legal notice at the top of this guide
Wireshark vs. Other Traffic Tools
| Tool | Primary Use | Best For |
|---|---|---|
| Wireshark | Deep packet inspection, GUI | Detailed, visual traffic analysis |
| tcpdump | Command-line capture | Lightweight capture on servers with no GUI |
| tshark | Command-line Wireshark | Scripting and automated capture using Wireshark's own dissectors |
| Zeek | Network security monitoring | Large-scale, ongoing traffic logging and alerting |
| NetworkMiner | Forensic traffic analysis | Reconstructing files and sessions from a capture for investigations |
Glossary
For terms beyond Wireshark itself, see our full cybersecurity glossary.
- Promiscuous mode
- A network interface mode that allows capture of all traffic on the segment, not just traffic addressed to your device.
- BPF (Berkeley Packet Filter)
- The syntax used by capture filters to decide which packets get written to the capture buffer.
- Dissector
- The piece of Wireshark's code responsible for decoding one specific protocol into readable fields.
- pcap / pcapng
- File formats used to store captured packets; pcapng is the modern default.
- Three-way handshake
- The SYN, SYN-ACK, ACK sequence that establishes a TCP connection.
- Retransmission
- A packet resent because the original wasn't acknowledged in time, usually a sign of packet loss.
Frequently Asked Questions
Is Wireshark legal?
Yes, when used on networks you own or have explicit permission to analyze. Capturing traffic on networks you don't control or lack authorization for can violate wiretapping and computer misuse laws.
Can Wireshark capture passwords?
Only if the traffic is unencrypted — modern HTTPS, SSH, and similar protocols prevent reading actual content, though metadata like connection timing, packet size, and (for TLS) the destination hostname (SNI) is still visible.
Is Wireshark beginner-friendly?
Yes, with practice. Starting with simple filters like icmp or dns and using Follow TCP Stream makes it much more approachable before diving into advanced filter syntax.
Does it work on Windows, macOS, and Linux?
Yes, Wireshark is fully cross-platform and free on all three, along with the tshark command-line variant.
What's the difference between Wireshark and tcpdump?
tcpdump is lightweight and command-line-only, using BPF syntax throughout, while Wireshark provides a full graphical interface, its own richer display filter language, and hundreds of protocol dissectors for deep visual analysis.
What's the difference between a capture filter and a display filter?
A capture filter decides what gets recorded in the first place and uses BPF syntax; a display filter only controls what you currently see and can be changed freely after the fact. See the dedicated section above for a full comparison.
Can Wireshark decrypt HTTPS traffic?
Only if you have the session keys or the server's private key (for older, non-forward-secret TLS configurations). For your own applications, setting the SSLKEYLOGFILE environment variable and pointing Wireshark's TLS preferences at that log file is the standard, legitimate way to do this for debugging. If your concern is what a VPN does or doesn't hide from packet-level analysis, our best VPNs roundup covers what's actually encrypted end-to-end.
How do I find suspicious traffic in a capture?
Start with Statistics → Protocol Hierarchy for anything unexpected, then Statistics → Conversations sorted by bytes for unusually large or long-lived connections, then filter for tcp.flags.reset == 1 or tcp.analysis.retransmission to spot connection problems worth a closer look.
Conclusion
Wireshark rewards the time you put into it. The interface itself takes an afternoon to learn; reading a TCP handshake at a glance, knowing capture filters from display filters instinctively, and reaching for Statistics before scrolling through thousands of packets by hand — that's the part that takes practice, and it's the same skill set whether you're troubleshooting a flaky office network or working an incident response case. Start small: capture your own traffic, follow a stream, and build the filter vocabulary one session at a time.